The depth sounder measures the distance from the transducer to the seafloor. What is indicated on the instrument depends on choices we make.
If no offset is introduced the instrument will indicate the distance between the sensor and the seafloor.
There are two schools of thought, one is to introduce an offset so the depth sounder indicates water below the keel, the other is to offset so that the indication is from the water line.
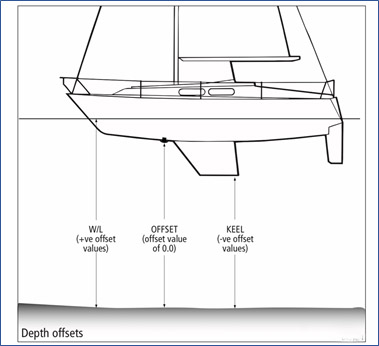
An indication of water below the keel is very useful in shallow waters with the associated risk of running aground. Quite often an additional offset is introduced (for example by the owner) to give an extra margin (Indicating 0.0 could mean 20 cm margin below the keel).
An indication of depth reduced to the water line is handy when using the depth as an additional navigation tool. This indication can then be compared with a chart (chart depth + rise of tide) as an aid in navigation. Following the 2m contour with a rise of tide of 1.5m means that your looking at 3.5m on the indicator.
Both settings have their advantages, as a skipper you need to know what setting is used on the yacht you sail on. Using an improvised lead line, you can easily check the offset on a particular yacht.
(Article written by Albert de Nijs for Dutch Offshore Sailing Academy / De Zeezeilers.nl).
2. Sailing the contours.
When sailing in restricted visibility it can be a valuable option to proceed outside the fairway into shallow waters. Safely out of the way of the bigger ships and following depth contours you can proceed to a safe place to drop anchor and wait for improved conditions.
When training for this situation we choose a curving depth contour. We need to know the offset of the depth sounder, from keel, transducer or waterline. Knowing the rise of tide, we can choose a contour to follow (following the 2m contour and rise of tide 1.7m you are looking for 3.7m on the indicator when the depth sounder is set to indicate from the waterline).
The navigator sits downstairs with a detailed chart, chart protactor and depth indication. He gives steering orders to the helmsman. When the depth decreases he steers towards deeper water and vice versa. If the SOG is 5 kts, the yacht covers 0.5nm per 6 minutes, and 0.25nm per 3 minutes. This way the navigator can assess the progress along the route. Starting at a known position (buoy) on a contour he can sail the yacht to safe waters and anchor over there (in this example into the Amsteldiep).
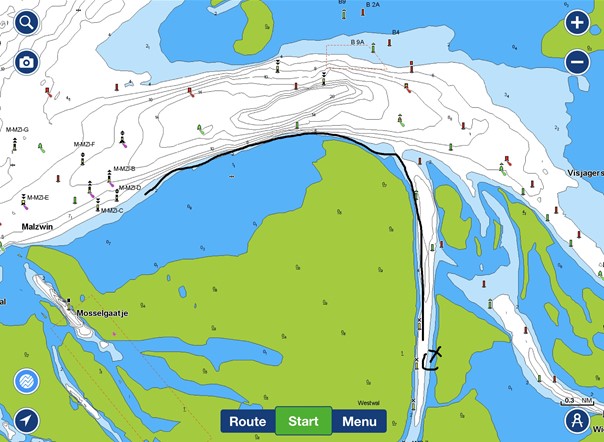
If you are crossing the fairway on your way to the Amsteldiep, aim to arrive offset of the exact position. Otherwise you will not know whether to turn to port or starboard if you did not arrive at the exact spot and finding the entrance would be a challenge. Better to be offset and know which way to turn and follow the contour!
(Article written by Albert de Nijs for Dutch Offshore Sailing Academy / De Zeezeilers.nl).
3. The art of Navigation
“Marine navigation is a blend of both science and art. A key union between the knowledge of theory, the application of mathematics and the exercise of seafaring instincts that have proven to be the crucial elements behind successful maritime voyages for millennia” (Bowditch, The American Practical Navigator, first published in 1802).
When first learning navigation it is easy to mix-up the tools used for navigation with navigation itself. Navigation is the process in the mind of the navigator, what is our position, where do we want to go, and maybe most importantly, where do we specifically not want to be.
Out on the ocean an estimated position within 30nm is quite adequate, while during pilotage in the Channel Islands the margins are very small. It is up to the navigator to choose the most suitable tools to determine the yacht’s position.
The tools at our disposal are amongst others charts, hand-bearing compass, buoyage, depth, gps, radar, local knowledge or simply dead reckoning. The prudent navigator has a filled toolbox, and chooses the best mix for the situation.
The present gps-plotters (or any other integrated navigation system with an electronic chart) provide a powerful tool for navigation. As navigator you should be aware of the limits of the system, but that will be discussed in a later topic.
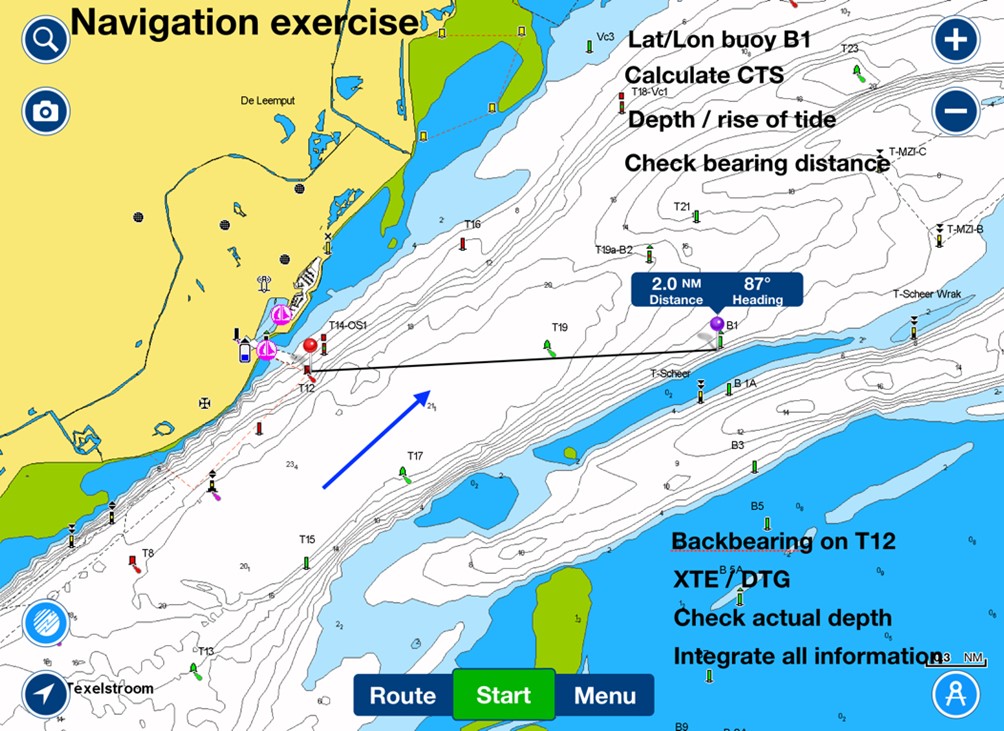
The following exercise helps in integrating traditional navigation tools with gps.
From the chart we find the Lat/Lon of a specific buoy (preferably unlit) and enter this in the gps. On the chart we shape a course from a lit buoy to this specific buoy. Sailing close to the first buoy the bearing/distance from the chart should be the same as the gps indicates.
Calculate the course to steer (CTS) and rise of tide.
Starting from the first buoy set course for the unlit buoy. Initially you can use both the back-bearing and the XTE/DTG from the gps. The navigator steers the yacht using this blend of information. Ideally both the back-bearing and the gps concur. Dead reckoned distance and DTG can be checked enroute. When the buoy on our back-bearing fades in the distance we have checked and tested the information from our gps. Combine this with a depth reading and you have successfully integrated several tools for navigation.
(Article written by Albert de Nijs for Dutch Offshore Sailing Academy / De Zeezeilers.nl).
Most of our modern charts still use the chart projection devised by Gerard Mercator in 1569. On paper charts it is easy to find the publication date, you can check whether the chart has been updated and you can even find the survey data. The source data on a single chart can range from 100+ year old lead-line surveys to shallow water multibeam surveys or even LIDAR data. The positions in the old data is less accurate, but it also gives spot measurements instead of mapping the whole seabed (IHO standards for hydrographic surveys). In areas frequented by commercial shipping the hydrographic data will be more up to date then in areas only used by pleasure boats.
Nowadays many sailors use a chart-plotter or similar device. This is basically a computer assisted navigation system capable of displaying electronic nautical charts and the vessel's position in near real time. The used electronic charts are derived from paper charts, with their inherent inaccuracies. Finding information about source data is more complicated because this information is hidden in Menus of the electronic chart system (Chart plotter, iPad or Navigation computer).
There are two sorts of electronic charts, the raster chart and the vector chart.
In a raster chart, data is a digitized image of a chart comprised of millions of pixels. All data is in one layer and one format. The video display simply reproduces the picture from its digitized data file.
Most electronic chart systems nowadays use vector charts, partly because the file size is much smaller. Vector chart data is organized into many separate files or layers. It contains graphics files and programs to produce certain symbols, points, lines, and areas with associated colors, text, and other chart elements.
Depending on zoom-levels, details (layers) will disappear from view. This happened on Vestas Wind (Volvo Ocean Race, Nov 2014) when they ran aground on the Cargados Carajos Shoals about 240nm northeast of Mauritius. You definitely need to zoom out for overview and zoom in for details!
In the electronic chart system, the accuracy of the gps is combined with the electronic charts which are based on paper charts, and thus far less accurate.
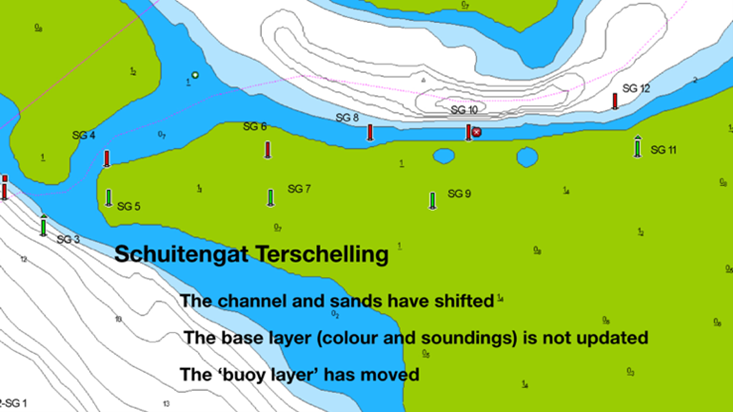
Especially in environments like the WaddenZee with shifting sands and channels, chart information gets out-of-date quickly. The base-layer of the chart is ‘fixed’, and buoys are in a separate layer. When a hydrographic survey discovers that the channel has moved, Rijkswaterstaat (RWS) will reposition the buoys and inform everyone via a Notice to Mariners. The layer of the chart containing the buoys is updated, but not necessarily the base-layer. On an electronic chart system, it seems like you’re driving over the sand-plates, while you are actually in the fairway. The chart of Schuitengat (Terschelling) indicates a drying height of 1m, while the present depth is around 1.4m at LAT (source: Brandaris).
(Article written by Albert de Nijs for Dutch Offshore Sailing Academy / Zeezeilers)
The steering and sailing rules of the Colregs (International Regulations for Preventing Collisions at Sea) are divided in 3 sections. The first one deals with the conduct of vessels in any condition of visibility, such as to keep a good look-out and safe speed. The second section discusses conduct of vessels in sight of one another such as the rules concerning the give-way and stand-on vessel.
The last section deals with the conduct of vessels in restricted visibility.
Restricted visibility means any condition in which visibility is restricted by fog, mist, falling snow, heavy rainstorms, sandstorms or any other similar causes.
In restricted visibility there is no stand-on / give-way vessel.
Except where it has been determined that a risk of collision does not exist, every vessel which hears apparently forwards of her beam the fog signal of another vessel, or which cannot avoid a close-quarters situation with another vessel forwards of her beam, shall reduce her speed to the minimum at which she can be kept on her course. She shall if necessary take all her way off and in any event navigate with extreme caution until danger of collision is over.
This is (a part of) the theory. In practice commercial ships rely heavily on radar and keep on going. They sound the required signals, but there is nobody on their bridge going outside to listen to your horn. Our best bet is to stay out of their way. Of course, radar and AIS make a big difference in these situations, especially if we are confident in using them!
Listed below are some points that we can (have to) do when navigating in or near an area of restricted visibility.
Reduce to safe speed
Sound a fog signal
Place extra look-outs – listen!
Set radar watch
Engine ready for immediate manoeuvre
Communicate using VHF
Leave the fairway, anchor in shallow waters
Crew above decks
Pyrotechnics and life-raft immediately available
(Article written by Albert de Nijs for Dutch Offshore Sailing Academy / Zeezeilers)
When broad reaching or running the foresail tends to get blanketed by the main. The sail just refuses to fill steadily, especially with some sea state. The top of the mast pulls the sail from side to side, resulting in flapping and losing drive.
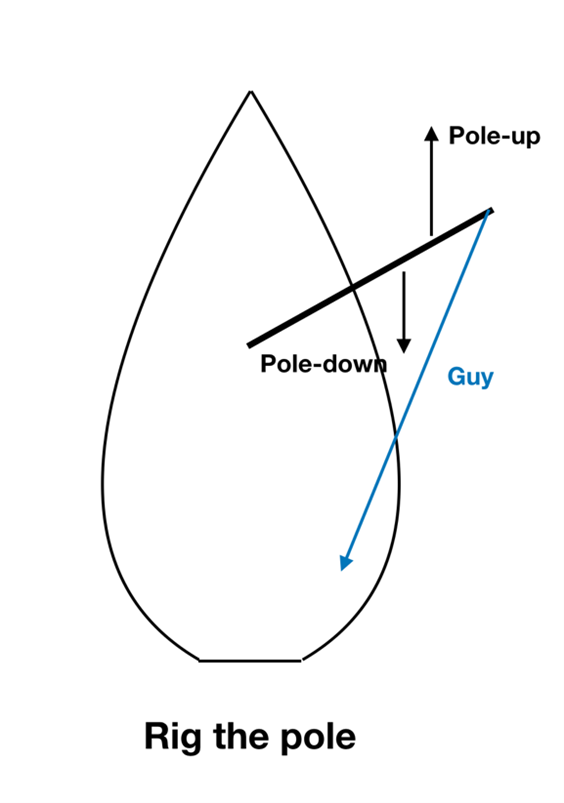
A solution to this problem is poling-out the foresail. The conventional set-up of the spinnaker pole has the following attention points:
- Lots of power on the pole (especially when the sail is attached to the pole)
- Unable to gybe or maneuver
- Pole unstable when sail is furled
Here we will discuss a different way of poling out the foresail. We’ll rig the pole using:
- pole up (uphaul)
- pole down (downhaul)
- guy
Now the pole is fixed and remains stable also when not under load.
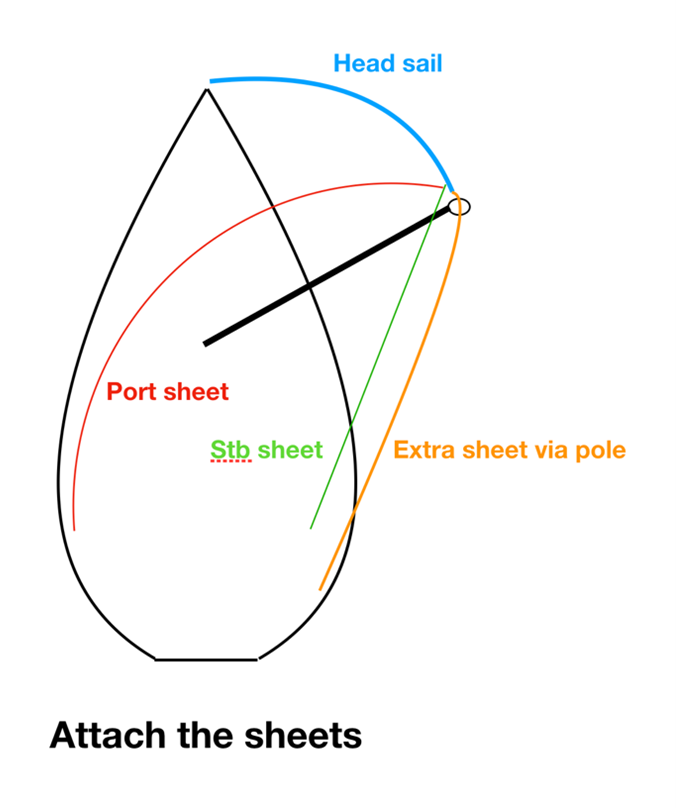
The normal jib-sheets remain attached to the clew of the sail, not via the pole. Using these sheets, we can still tack and gybe and furl the foresail. It is even possible to sail upwind up to a close reach, so the yacht remains maneuverable.
A single extra sheet (long) is attached to the sail and fed aft via the pole.
Via the extra sheet you are able to run flat downwind with a flattened foresail. When using the normal sheets there is no load on the pole, while the pole remains stable due to the uphaul, downhaul and guy.
We can do the same with the boom. Using the downhaul, preventer and sheets we can secure the boom which prevents the main from flapping. This way we have a safe and stable set-up for downwind sailing!
(Article written by Albert de Nijs for Dutch Offshore Sailing Academy / Zeezeilers.nl)
In this series of articles, we will discuss sea-state, shoaling at the continental shelf, hurricanes, pilot charts and finally the Atlantic circuit.
But let’s start with waves and sea state.
There are two sorts of waves, those created by the wind (called sea), and (ocean) waves that continue on without relation to local winds which are called swell.
Sea state is the effect that the local winds have on sea conditions – this is independent of travelling swell waves generated by winds outside of the local area. The Beaufort scale was originally introduced to describe how ships handled in specific wind and sea-state conditions. Nowadays a wind speed is assigned to the Beaufort scale.
Three factors determine the height of a wave: the windspeed (obvious), the duration (how long this wind has been blowing) and the fetch which is the length of water over which a given wind has blown. Strong winds with a short fetch or short duration will not result in high waves. Below is a table indicating the relation between windspeed and wave height with sufficient depth, duration and fetch.

Since waves consist of many independent wave systems at the same time, the sea acquires a complex and irregular pattern. When reporting wave height there is a tendency to neglect the lower ones. Significant wave height is used, which is the average height of the highest one-third of the waves. Since wave patterns interfere, this implies that there are also higher waves, 1% (about one every 10 minutes) of the waves is 1½ times higher and the max wave height is almost 1.9 times the significant wave height! As we can learn from this table, 20 kts wind results in a significant wave height of around 2.0m and the maximum wave height around 3.7m.
When waves meet shallow water, obstacles or an opposing current (wind against tide) the nature of the wave changes. In this article we will focus on waves in decreasing depth.
When the depth decreases (depth < ½ wave length) the waves begin to interact with the seabed. The result of this friction is an increase in wave height: this process is known as shoaling. As the depth further decreases the wavelength gets shorter and the wave becomes steeper.
When the steepness (height/wavelength) becomes greater then 1/7 the crest becomes unstable and the wave will break.
With a windspeed of 5 Bft, significant wave height = 2m, and a wavelength of 14m, there might be a wave of almost 4m height and breaking waves are possible at a depth of 7m. A lee-shore with a long fetch can produce dangerous seas (example: Stortemelk in NW 7).
Breaking waves are dangerous, because when the wave is higher than the beam of the yacht (30-60% of the hull length) and it breaks on the beam of a yacht, capsize is a definite possibilty!
(Article written by Albert de Nijs for Dutch Offshore Sailing Academy / Zeezeilers.nl )
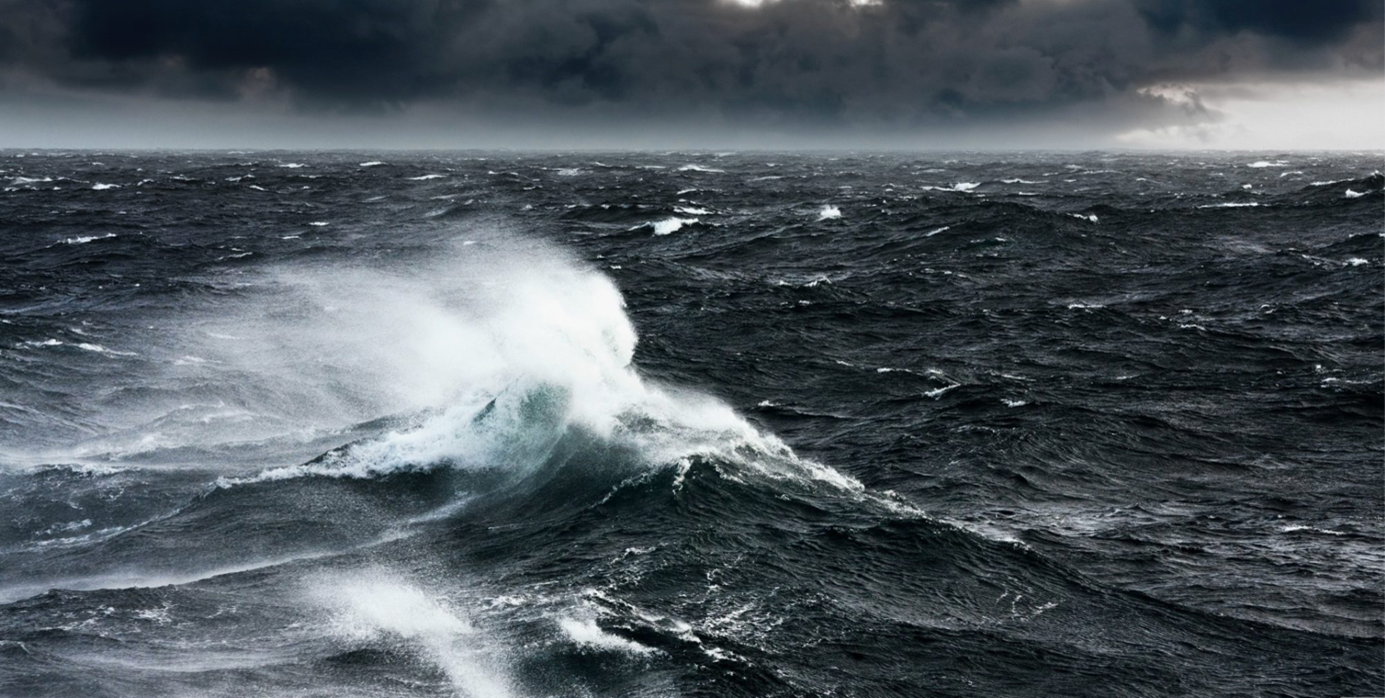
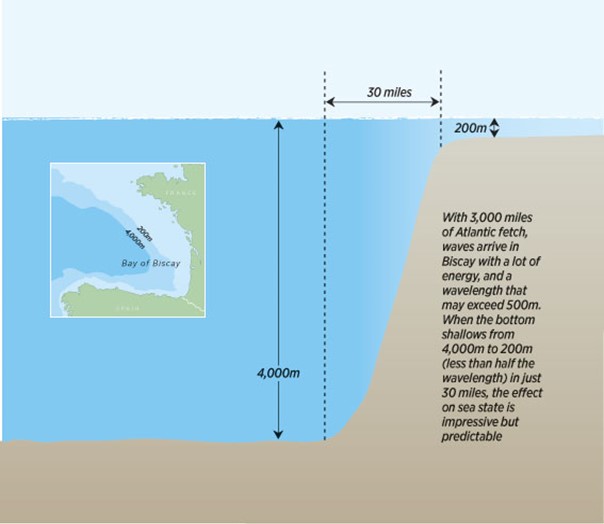
We have seen in the article about sea-state that in water shallower than half the wavelength, the seabed starts to interfere with the wave structure. It slows the waves down, they pile up, get shorter, steeper and higher. An underwater obstacle such as a seamount or offshore reef can cause a bigger wave than usual to rear up, apparently out of nowhere, and break, sometimes with tremendous violence. In the North Atlantic, the swell’s wavelength can be 500m or more, and because it’s the wavelength that influences this effect, breaking waves can happen in surprisingly deep water and with little warning.
On a large scale this also happens at the continental shelf. At the edge of the continental shelf the seafloor rises sharply from 4000m to 200m. This is less than half the wavelength so it affects the sea state. To add to the problem, the continental shelf slows down the momentum of the leading swells allowing the ones behind to catch up. The wave heights stay the same; it’s just that the peaks become closer together and the wave faces become steep and treacherous. This is one reason for the fearsome reputation of the Bay of Biscay.
The lee-shore of the Moroccan coast at Rabat is another location where ocean swell breaks on the shallow coastline. The swell could originate from a depression more then 1500nm away, causing breaking waves in an area with little or no wind.
(Article written by Albert de Nijs for Dutch Offshore Sailing Academy / Zeezeilers.nl)
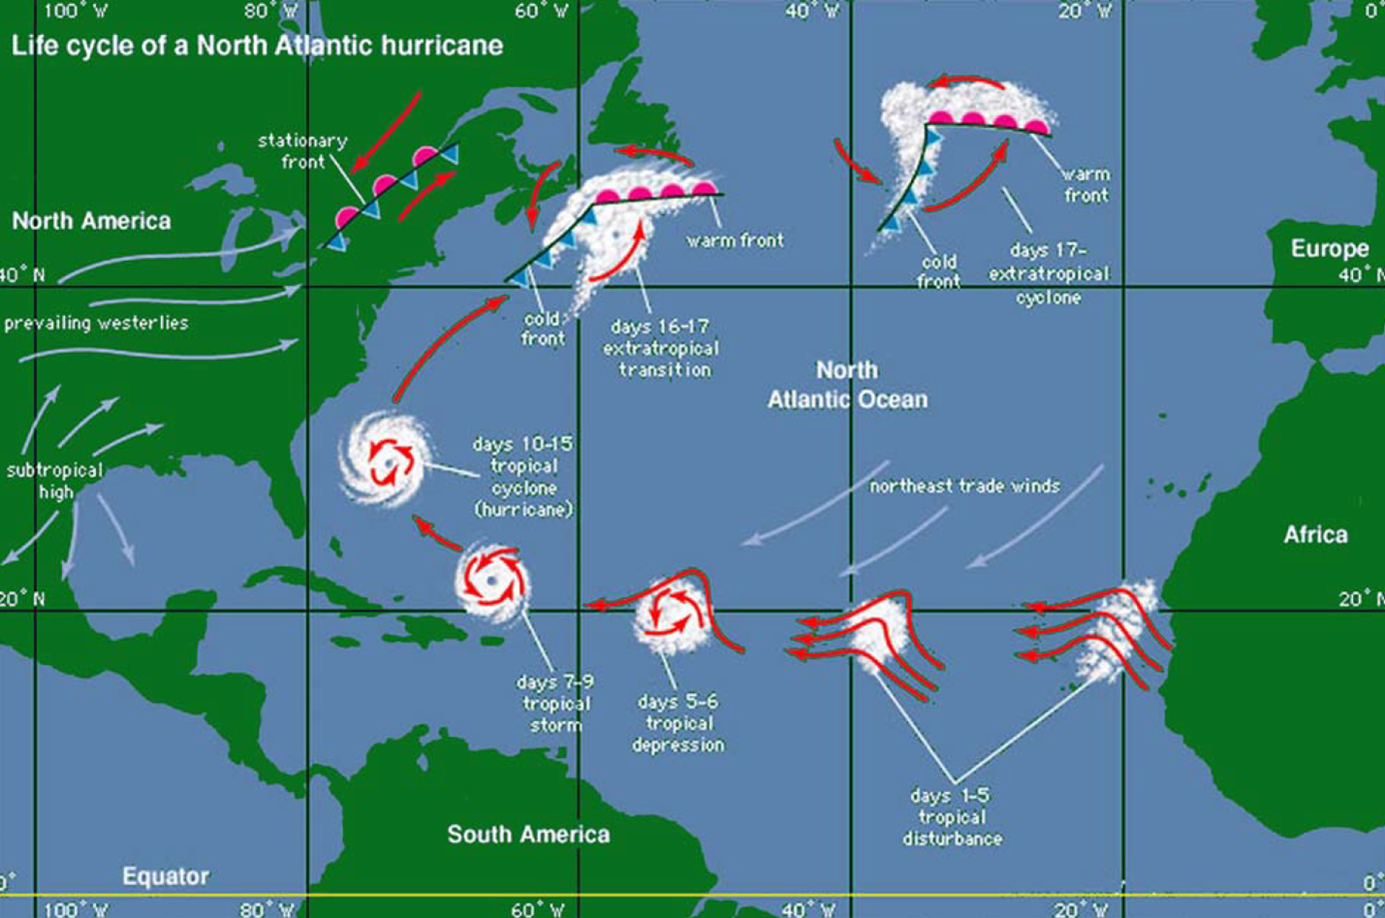
In the Indian Ocean it’s called Cyclone, around the Western North Pacific they call it a Typhoon, and in the North Atlantic they call it a hurricane. With possible windspeeds of over 135 kts from various directions, it is a real threat to mariners.
In this article we will focus on hurricanes in the North Atlantic.
- Warm sea surface temperature (>26.5°C) of sufficient depth (June - November)
- Poleward of 5° N or S - enough coriolis effect to provide cyclonic circulation
- Unstable atmosphere
- Initial disturbance (easterly wave)
- High humidity low-mid levels
- Low vertical windshear (
Looking at these required conditions the area and the season where hurricanes can develop becomes clearer. Warm sea water temperatures, so in the summer months and close to the equator, but not too close.
When a hurricane reaches land, it loses it’s driving force. When it curves to the North it might form the basis for a depression later on over the ocean. The National Hurricane Centre issues Tropical cyclone forecast / advisory (TCM). Pilot charts indicate the months and tracks of past hurricanes. We will discuss pilot charts in a next article.
We should avoid sailing in the hurricane season, but occasionally hurricanes have developed outside these months. In the North Atlantic there are on average 12 hurricanes per season.
The hurricane warning signs are:
- Weather reports / warning message (Tropical cyclone forecast / advisory)
- Unusual swell
- Barometric drop > 3 mb below normal (diurnal variation, see below)
- Change in wind direction / speed
- Exceptionally good visibility
- Sky – extensive Ci (Central dense overcast)
- Colourful sky at sunrise / sunset
- Frequent lightning / squalls
Diurnal pressure variation.
3 hPa below seasonal average probable development of TRS
5 hPa below seasonal average presence of TRS within 200 nm
20 hPa drop well developed TRS
A developing tropical depression might grow into a tropical storm and later into a hurricane. Hurricanes are classified using the Saffir – Simpson Hurricane Scale. A Category 1 hurricane has windspeeds > 65 kts, a Cat 5 hurricane more then 135 kts.
Since predicting the path of a hurricane is notoriously difficult the 123 Rule is used. An ‘area to avoid’ is plotted using the 34kts wind forecast + a safety margin for 24 – 48 – 72 hrs.
(Article written by Albert de Nijs for Dutch Offshore Sailing Academy / Zeezeilers.nl).
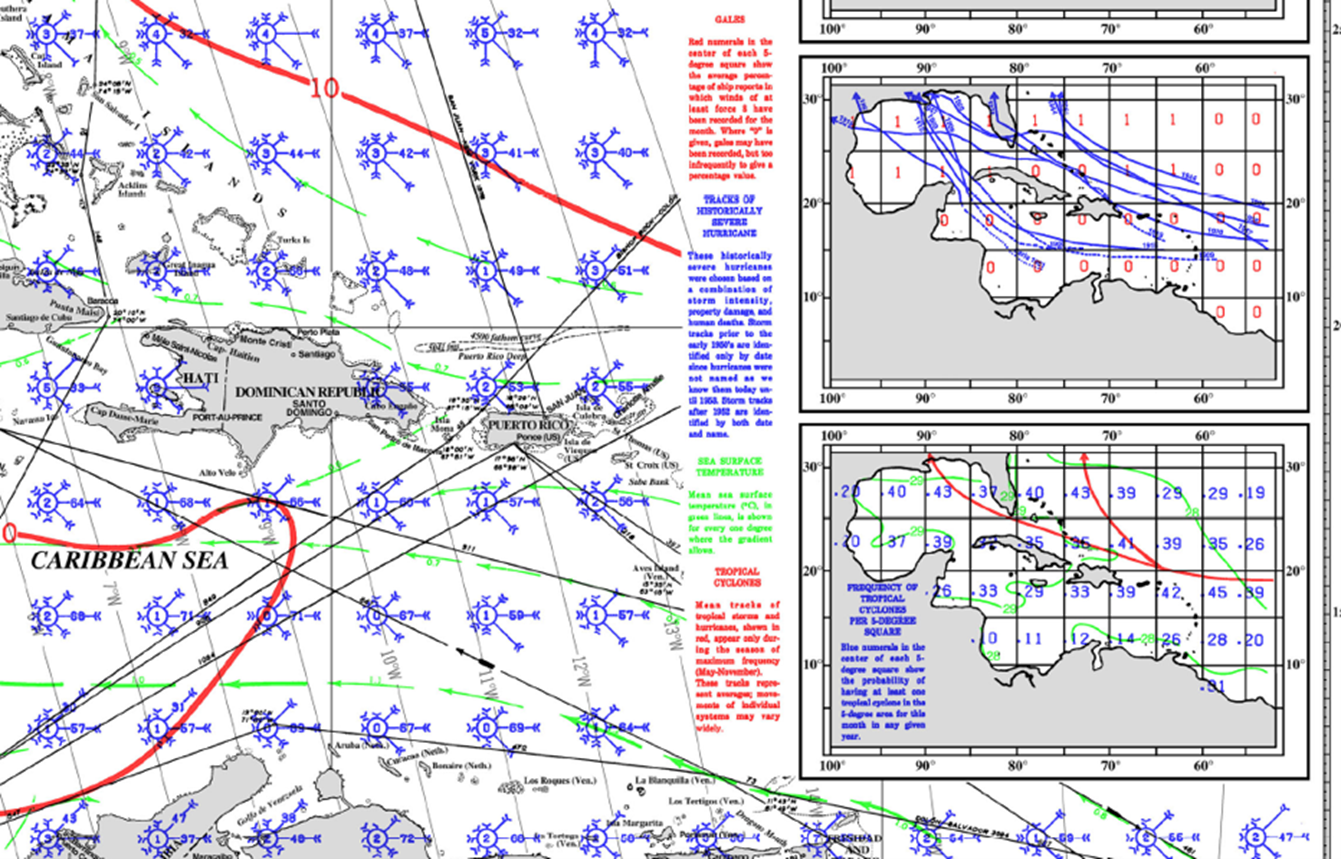
Pilot charts (or routeing charts as they are called in the UK) offer a wealth of information, organized per region per month on a chart. They are considered essential for planning a safe and efficient passage.
This is the kind of information that is needed even before you start actually planning a specific voyage, as it will allow you to decide straight away whether your plan is feasible. Once you’ve decided that your plan is feasible, you can proceed to the next stage, and that is to plan a voyage along a route that has the best chance of favorable sailing conditions.Pilot Charts depict averages in prevailing winds and currents, air and sea temperatures, wave heights, ice limits, visibility, barometric pressure, and weather conditions at different times of the year. The information used to compile these averages was obtained from oceanographic and meteorological observations over many decades during the late 18th and 19th centuries.
That also means that recent changes in weather patterns are not included, you’re looking at long term averages. As mariners like to avoid areas with severe weather, these areas might be under-reported.
In the previous article we discussed TRS’s. The mean tracks of Tropical cyclones and their frequency can be found on pilot charts.
A quick internet search will yield results for these charts, look for Maritime Safety Information (MSI) North Atlantic Pub #106 (free download) or go to:
https://www.offshoreblue.com/navigation/pilot-charts.php
(Article written by Albert de Nijs for Dutch Offshore Sailing Academy)


